Risk Management Strategies with Stop-Loss
When it comes to Risk Management Strategies with Stop-Loss levels and trailing stops are essential tools. But can chart analysis provide valuable insights for implementing these risk management strategies effectively? In this blog post, we will explore the relationship between chart analysis and risk management, and how utilizing these techniques can help traders make informed decisions.
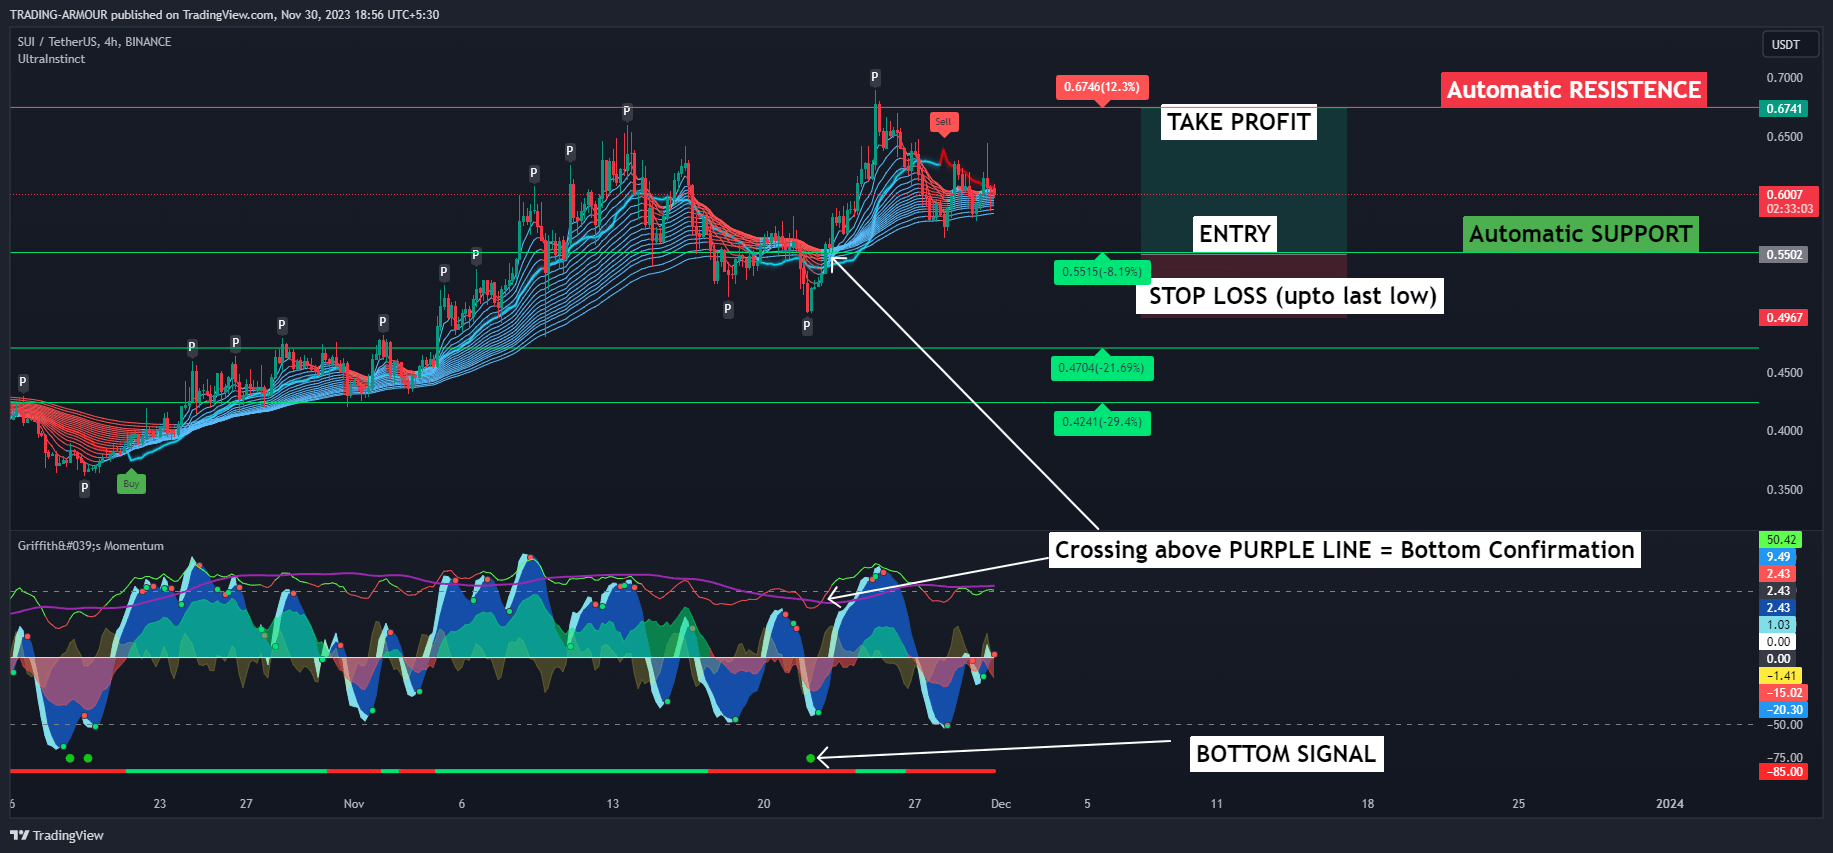
To get Automatic Stop Loss, take profit target and Risk Analysis Indicator visit this website https://www.tradingarmour.com
1. Understanding Chart Analysis:
Before delving into risk management strategies, it’s crucial to familiarize ourselves with chart analysis. Chart analysis involves studying price patterns, trends, and indicators displayed on financial charts. It aims to identify potential market movements, turning points, and entry/exit levels.
2. Identifying Support and Resistance Levels:
Chart analysis can shed light on key support and resistance levels, which act as natural barriers for price movements. These levels can help traders determine where to place stop-loss orders, limiting potential losses if the market moves unfavorably. By identifying these levels accurately, traders can set stop-loss orders that align with their risk tolerance and trading strategies.
3. Utilizing Technical Indicators:
Technical indicators provide additional information about market trends, strength, and potential reversals. By incorporating these indicators into chart analysis, traders can better gauge the market’s momentum and determine optimal stop-loss and trailing stop levels. Popular indicators such as Moving Averages, Relative Strength Index (RSI), and Bollinger Bands can assist in spotting potential risk and adjusting stop-loss levels accordingly.
4. Recognizing Chart Patterns:
Chart patterns, such as head and shoulders, double top/bottom, and triangles, can indicate potential market reversals or continuations. By incorporating pattern recognition into chart analysis, traders can establish stop-loss levels that align with these patterns, reducing the risk of adverse price movements.
Conclusion:
Chart analysis plays a crucial role in enhancing risk management strategies in trading. By incorporating the insights gained from chart analysis, traders can set appropriate stop-loss levels and trailing stops. This allows them to mitigate potential risks and protect their capital from adverse market movements. Understanding support and resistance levels, utilizing technical indicators effectively, and recognizing chart patterns are essential steps in maximizing risk management efforts.